
日本語 / English
Ask your location data.
MCP server for location intelligence
SilentLog Analytics MCP lets AI assistants work with location and behavioural data directly. Ask something like "How did foot traffic around the station change last month?" and a report comes back.
MCP (Model Context Protocol) is an open standard for connecting AI assistants to external systems.
How it works
Several data sources are brought together into one analytical layer that can be called from AI assistants and from your own applications. The client does the calling: the AI picks the tools a question needs and runs them. There is no dashboard to learn.
DATA SOURCES
- SilentLog behavioural data
- Open data
- Your own data
- Mobile carrier statistics
WHERE YOU CALL IT FROM
- AI assistants and agentsClaude, ChatGPT and others
- Web applications
- Mobile applications
All of the above are technically supported. Testing was carried out against the Claude API. Any MCP-compliant client can connect, including web and mobile applications you build yourself.
Using mobile carrier statistics requires separate terms to be agreed with the data provider. For your own data, we will confirm the format and connection environment and advise individually.
Location analysis tends to stall in the same places.
- Aggregating and charting takes so long that you never reach the question you wanted to ask
- Only a few people can run the analysis, so everyone else waits
- You have the data, but no one is sure how far you are allowed to use it
- You have no data of your own, so the project never starts
SilentLog Analytics MCP replaces that work with a conversation.
What you can do
-
Turn area foot traffic into a report
Specify a location and a period to summarise visitor counts, dwell time and movement. Daily, hourly and day-of-week breakdowns are supported. You can ask questions such as how weekday visitors differ from weekend ones.
-
Analyse movement and behaviour patterns
See where people come from and where they go, and by what means (on foot, by bicycle, by car, by train). Useful for catchment studies and for measuring the effect of a campaign.
-
Estimate visitor attributes
Refer to estimated data on visitors to an area, including tendencies in place of residence and place of work.
An example
YOU ASK
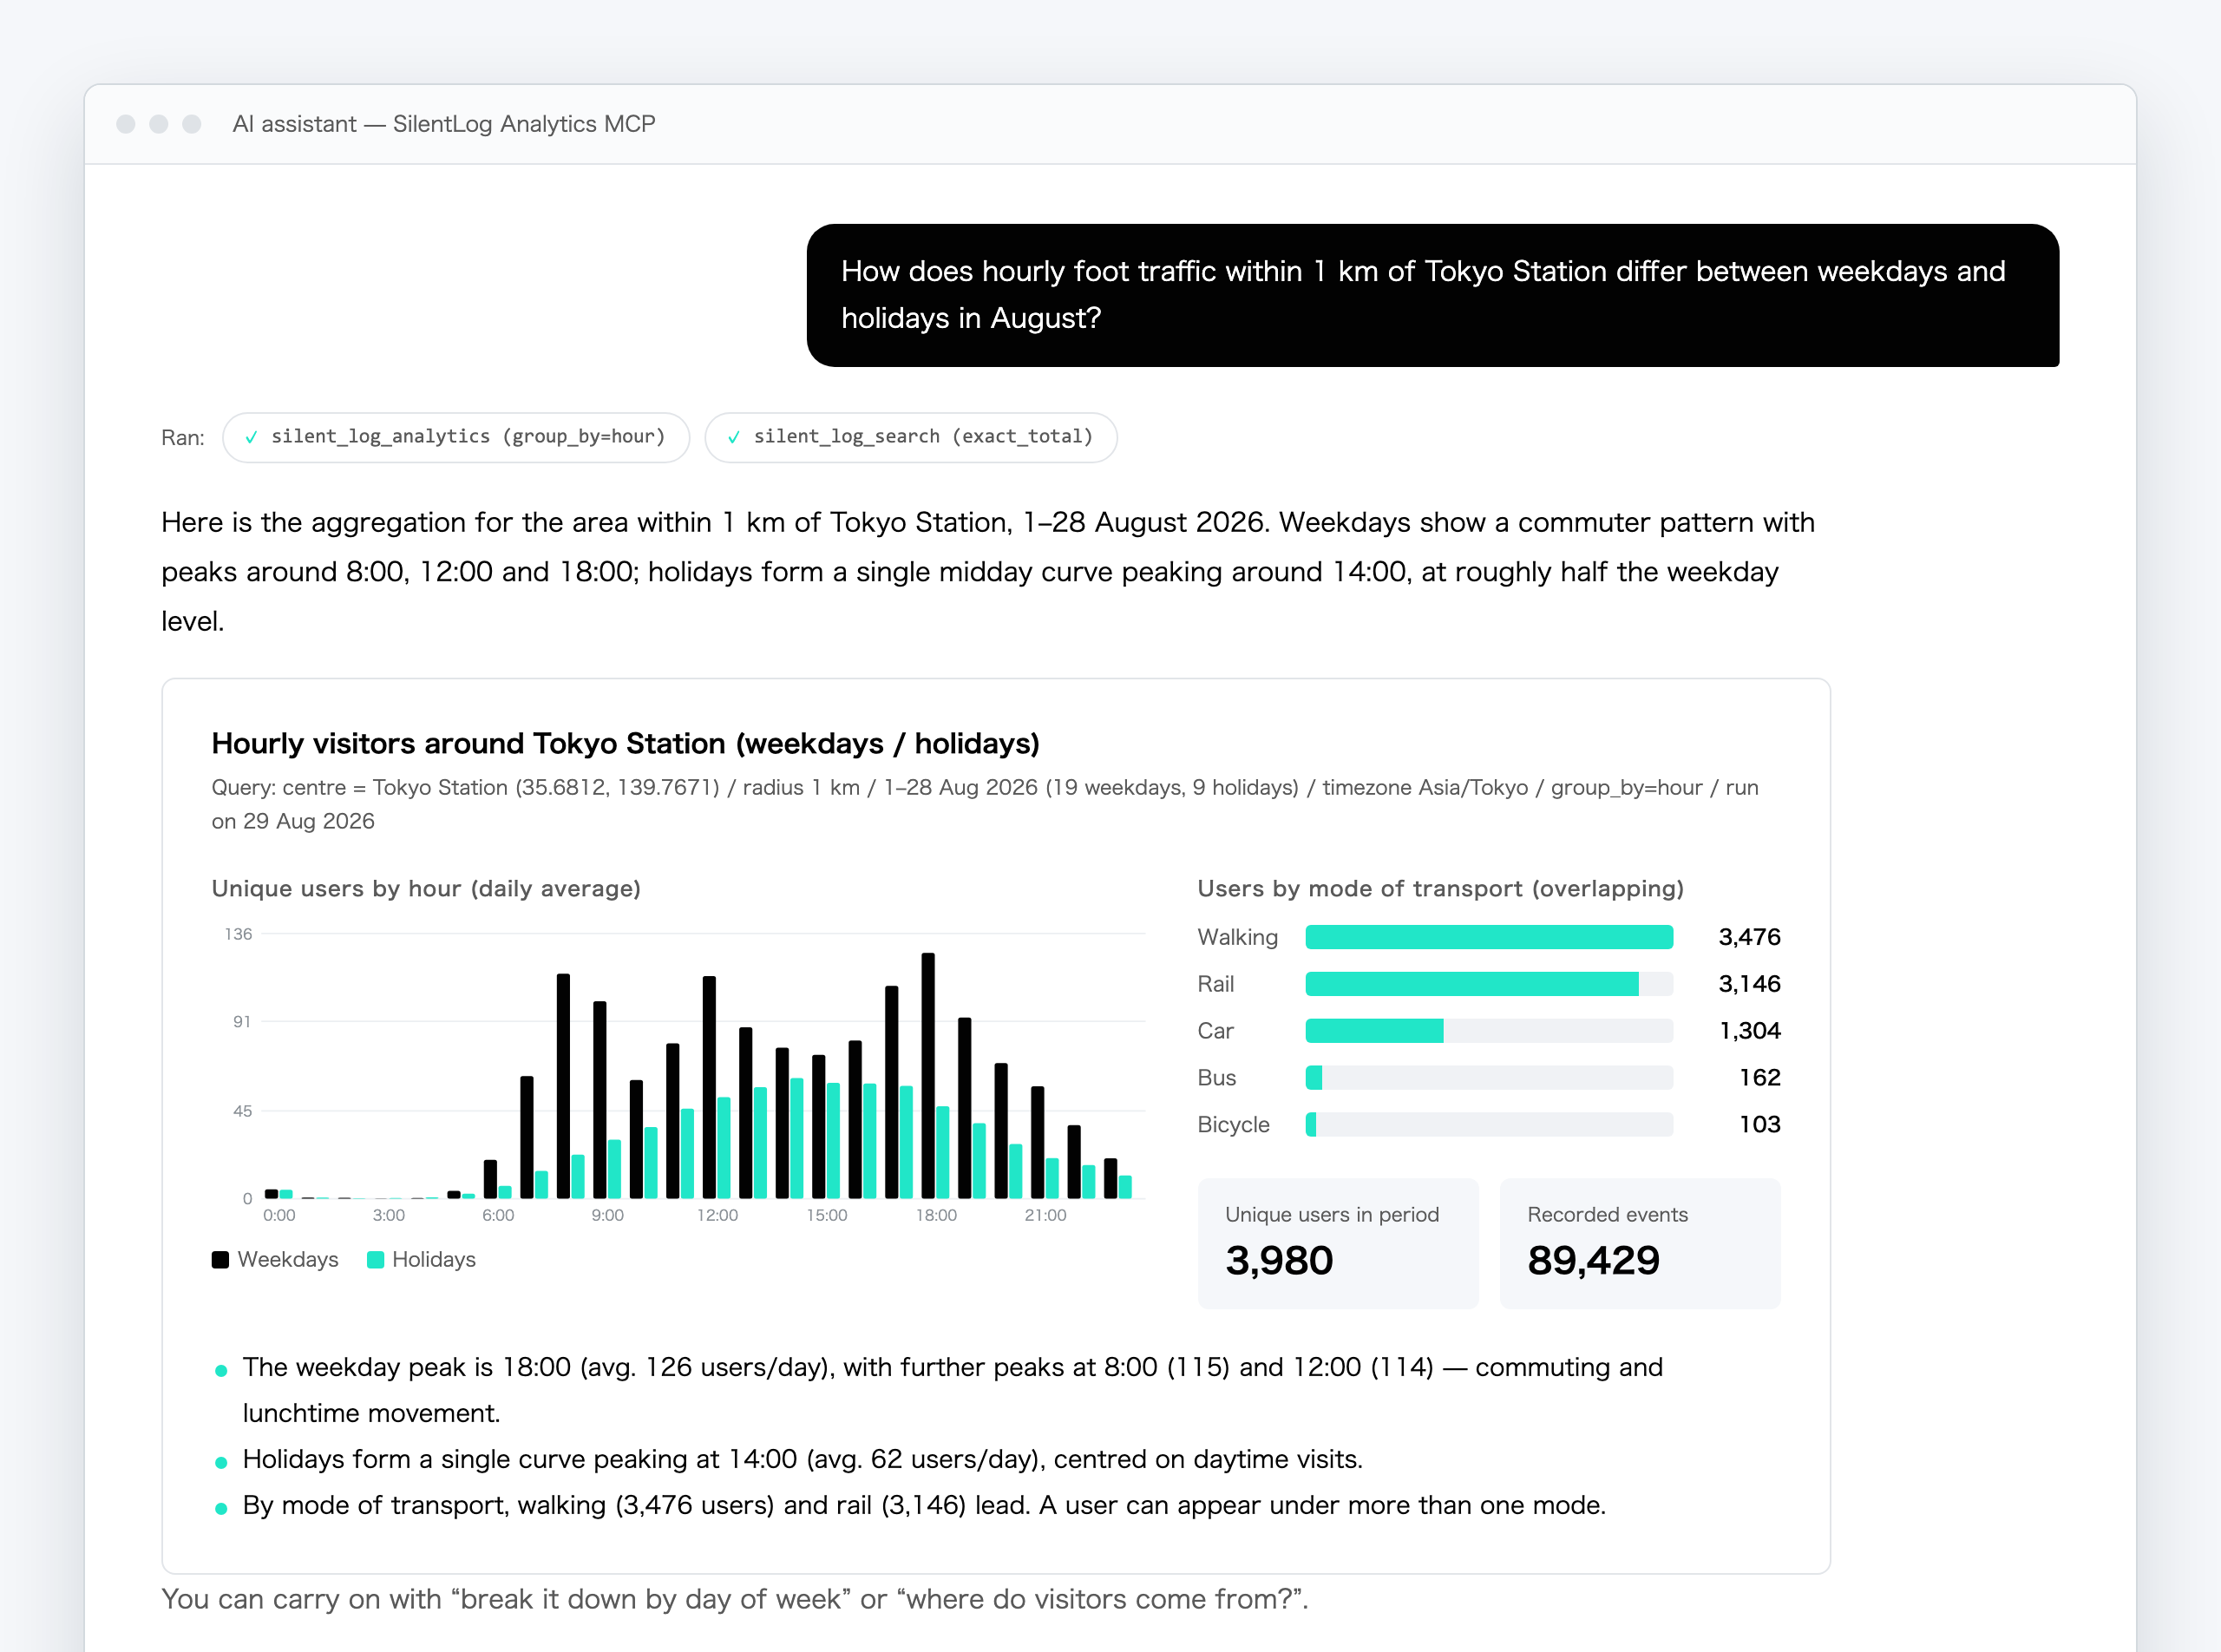
Within one kilometre of Tokyo Station, how did the hourly distribution of visitors differ between weekdays and weekends in August?
Which areas are the people visiting this retail site coming from?
Did the way people travel past the station change between last month and this month?
YOU GET BACK
- Visitor counts by day, by hour and by day of week
- A breakdown of how people travelled
- Patterns of dwelling versus passing through
- Results annotated with the conditions used: period, location and radius
From there you can simply say "chart that" or "write it up as a report". No analytical background is required; changing the question changes the angle.
Available functions
Nine functions are provided. The AI assistant selects and combines whichever ones your question requires. Parameters and constraints are documented on the technical reference page.
Retrieving and analysing foot-traffic data
silent_log_search / silent_log_analytics
Retrieve behavioural data for a given location and period. The combined analysis function performs retrieval and aggregation together, with grouping by day, hour or day of week.
Searching estimated attributes
profile_search
Search estimated data on visitors, such as place of residence, place of work and other attributes. This is a snapshot from a fixed point in time and differs from the foot-traffic data.
Maps and address lookup
maps_address_search / maps_geocoding / maps_schema_list
Resolve coordinates from a facility name or address, or find nearby facilities from a set of coordinates, so you can specify a place in plain language.
Statistical processing
analytics_statistics / analytics_clustering / analytics_histogram
Calculate statistics, cluster locations or behavioural patterns, and produce distributions. Useful when you want to work further with data you have already retrieved.
- How you connect
- Provided as an MCP (Model Context Protocol) Streamable HTTP endpoint. Authentication is by JWT (RS256) or API key.
- Supported clients
- Any MCP-compliant client can be used. That includes AI assistants such as Claude and ChatGPT, as well as applications you develop yourself. Testing was carried out against the Claude API.
- Availability
- The service runs across multiple availability zones and scales with load. It is provided on the basis of continuous operation.
- Technical reference
- Parameters and constraints for each tool are documented on the technical reference page.
- About the interface
- There is no dedicated dashboard. This is a server-side service; the AI assistant or application you already use becomes the interface.
Where it is used
Retail and commercial facilities
Understand catchment from the movement of people before and after a visit, and use it for promotion and site decisions. Compare how flows change before and after a campaign.
Transport and tourism
Understand visitor patterns at stations and destinations by hour and by day of week, and use them when planning services and capacity.
Public sector and research
Supply evidence for planning with actual movement patterns that surveys alone cannot capture.
A real report
What to expect
- Analysis is anchored to a location
- Analysis starts from a point (an address, a facility name or coordinates) and covers a radius of up to ten kilometres. Aggregating the whole country in one query is not possible; multiple sites are analysed one at a time.
- Periods of up to 31 days
- A single query covers a maximum of 31 days. Longer periods are analysed in parts.
- Historical data is available
- Accumulated behavioural data can be analysed for past periods. Same-day data is available too, but represents a partial total up to the moment of the query.
- We do not store your data
- This service is a connective layer. We do not copy or retain the data being analysed; it stays under the control of each data source.
- Estimated attributes are not updated on a schedule
- Visitor attribute estimates are a snapshot from a fixed point in time and are not refreshed monthly. Because the timing differs from the foot-traffic data, please consult us when using the two together.
Getting started
- Get in touch and tell us what you want to find out and what data you have. Having no data of your own is fine.
- We talk it through: what is possible, how it would work, and on what terms.
- We set up an environment configured to your use case.
- You start using it.
Pricing depends on the use case and configuration, so we quote individually.
Questions we are often asked
Can we use this without any data of our own?
Yes. You can start with SilentLog behavioural data or open data. Tell us the area you want to look at and what you want to know, and we will check what data is available.
Can we analyse data we already hold?
Yes. We confirm the format and the connection environment, then advise on how to bring it in. For mobile carrier statistics, the technical side is confirmed, but terms need to be agreed separately with the provider.
Is the analysis real time?
No. Same-day data is available, but it represents a partial total up to the moment of the query. The service is designed around analysing accumulated data for a specified past period.
Can we aggregate the whole country at once?
No. Analysis runs from a point outward to a radius of up to ten kilometres, so multiple sites are analysed one at a time. The same analysis can be run anywhere by changing the location.
Can we use clients other than Claude?
Yes, any MCP-compliant client works. That includes AI assistants such as ChatGPT and applications you build yourself, whether web or mobile. Testing was carried out against the Claude API.
Do you store our data?
No. We do not copy or retain the data being analysed. This is a connective layer, and the data stays under the control of each source.
Does it handle personally identifiable data?
No. Analysis is performed on aggregated data, and visitor attributes are referenced as statistical estimates.
Is there a dashboard?
No. This is a server-side service, and the AI assistant or application you already use serves as the interface. There is no new tool to learn.
Whether you have data sitting unused, need evidence for a proposal, or simply want to know what is possible, we are glad to talk at any stage. If you have no data of your own, we can start from open data.
Rei Frontier Inc. has been building location and AI technology since 2008, and holds a patent in behaviour recognition (Japanese Patent No. 7657484, with one further application pending).